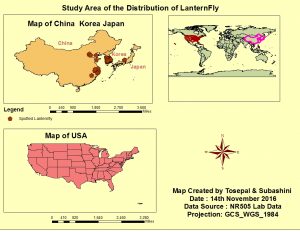
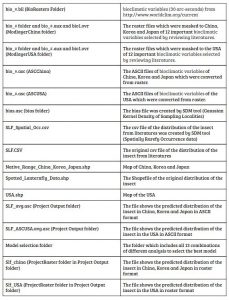
Origin
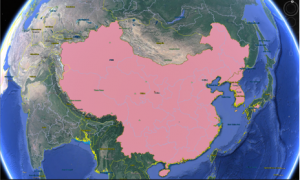
Spotted Lanternfly is native to northern China (Liu 1939). It was first detected as an exotic species in South Korea in 2004, and has since rapidly spread to different parts of that country (Kim and Kim 2005). More recently, individuals have been detected in Japan (Kim et al. 2013).
Host Range
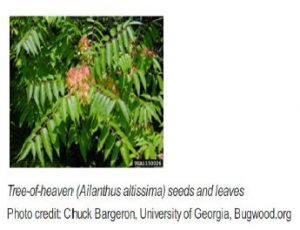
Spotted Lanternfly feeds on a variety of host plants including fruit trees, ornamental trees, woody trees, and vines Apples, birch,cherry, grapes, lilac, maple, poplar, stone fruits, and tree of heaven are among >70 species of principally woody hosts attacked by this pest. Observations in South Korea suggest that this species has a wider host range early in life as young nymphs and the host range narrows as they grow older especially before egg laying (Kim et al. 2011a). As tree of heaven is a preferred host for egg-laying adults, it can be used as a sentinel plant to monitor this species.
Life Cycle
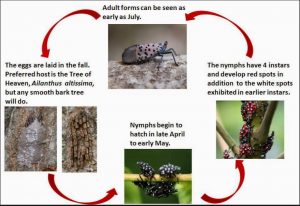
Eggs are deposited in groups of 30–50 and covered in yellowish brown waxy deposits which later hardens to form an oothecum. Waxy deposits disappear from emerged egg masses revealing brown, seed-like eggs. The remnants of egg masses may be observed on trees for one year or more after hatching.
The first three instars have a black body and legs with white spots.The fourth instar retains the spots but has a reddish body with distinctive red wing pads. Male and the female planthopper superficially resemble a moth with a wider abdomen.. Adults are often confused with some moths (especially species of noctuid underwings) due to the strikingly colored hindwing and size.
Damage
n China, the spotted lanternfly is a reported pest of a diverse range of shrubs and trees, including tree of heaven (A. altissima), Chinese Mahogany (T. sinensis), white cedar (Melia azedarach), black locust (Robinia pseudoacacia), cottonwoods (Populus spp.), willows (Salix spp.), grapes (Vitis spp.), and apples (Malus spp.) (Xiao 1992, Zhang). Since its arrival in Korea, this species has caused economic damage in vineyards, while large aggregations on A. altissima and other susceptible trees may create a nuisance in urban areas and roadsides (Han et al. 2008, Lee et al. 2009, Park et al. 2009).
Adults and nymphs feed on phloem tissues of young stems and bark tissues with their piercing and sucking mouthparts and excrete large quantities of liquid (Ding et al. 2006). Adults and older nymphs will feed in groups, especially later in the season on preferred hosts. Extensive feeding results in oozing wounds on the trunk and wilting and death of branches. Significant honey dew and sooty mold deposits around the base of trees are also noted from feeding of this insect. Signs of infestation include the presence of ants, bees, hornets or wasps attracted by honeydew and tree sap.
Origin of Spotted Lanternfly
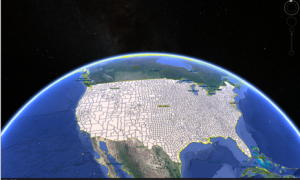
Prediction Area (US)
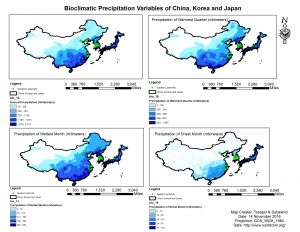
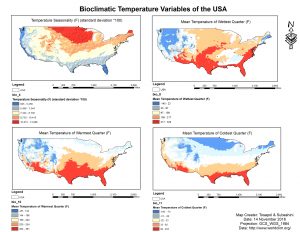
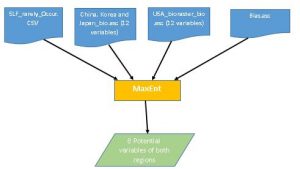
The section shows all the base maps from our project. The variables used to predict the distribution of the insect in both regions are bioclimatic variables, therefore showing the bioclimatic variables as base maps will support our understanding of the study areas.
There are 4 different groups of the variables which are significantly important.
- Bioclimatic temperature variable of China, Korea and Japan, this figure shows the variety of the temperature of different areas in those countries
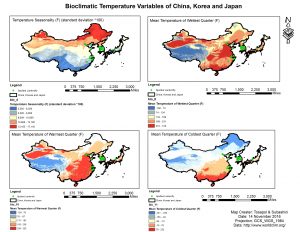
- Bioclimatic temperature variable of China, Korea and Japan, this figure shows the variety of the temperature of different areas in those countries.
- Bioclimatic temperature variable of the USA, this figure shows the variety of the temperature of different areas in the USA.
- Bioclimatic precipitation variables of the USA, this figure shows the variety of the precipitation of different areas in the USA.
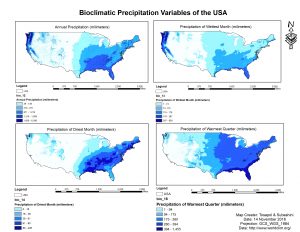
* bio_# = bio_1, bio_4, bio_5, bio_8, bio_10, bio_11, bio_12, bio_13, bio_14, bio_15, bio_16 and bio_18
Material and Methods
Occurrence Data : We have used the CSV file of the distribution of Spotted Lanternfly from the literatures (in China, Korea and Japan). This file contains the occurrence points of the species in the naive region
Environment Data :For this study, we considered 12 environment variables ,out of which 6 were derived from the monthly temperature and 6 from the monthly precipitation.These variables were obtained from the WorldClim dataset (http://www.worldclim.org/) at ~1-km/30 arc-seconds spatial resolution. Data at ~1-km spatial resolution was used to account for potential spatial inaccuracies in species occurrence data, and climatic model accuracy due mainly to the low number of weather stations in some parts of the globe.
Data preparation
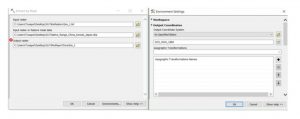
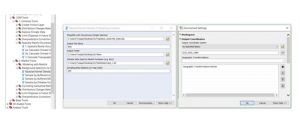
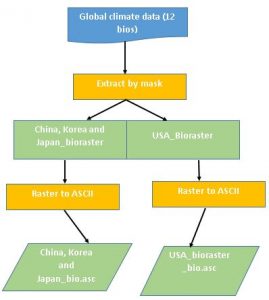
Step 1 : Modifying Environmental Layers using ArcGIS
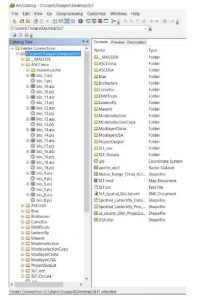
We modified our 12 environment layers, so that all our spatial data are consistent to the same cell size , extent and projection. This is done by loading all the 12 layers into ArcMap and then masking (Spatial Analyst tool – Extract by Mask) them based on the native range (China, Korea and Japan map) and predicted distribution range (USA map).
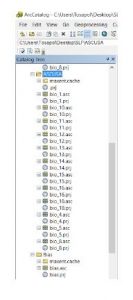
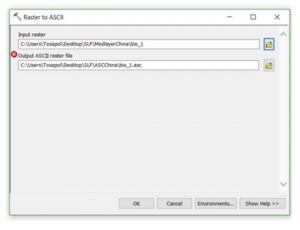
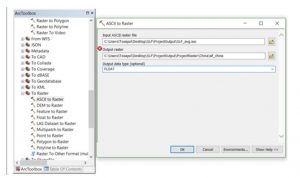
Step 2: Converting Environment Raster to ASCII Format (All variables of both regions)
We converted all our environment rasters (from step 1) to ASCII format, which is required for MaxEnt model execution. This is done by loading each of the raster in the ArcMap and with the help of the Raster to ASCII conversion tool. This is done for all the rasters in native range and predicted distribution range.
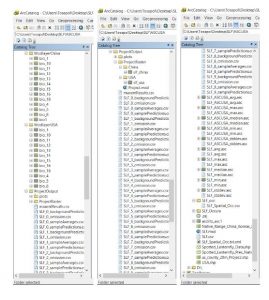
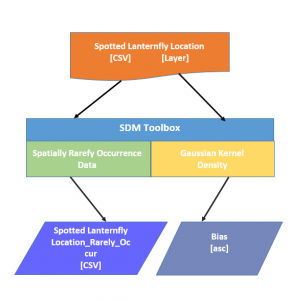
Step 3: Preparing Occurrence Data – Spatially Rarefy Occurrence data
In this process we need to generate unbiased sample for our modelling data, therefore we eliminate environmental biases from the SDM from spatially autocorrelated occurrence points,so that our input data will be spatially independent. This is done using the ArcGIS->SDM Tools-> Spatially Rarefy Occurrence Data.
Step 4: Background Selection via Bias Files
In this process we will account for the differences between the occurrence data and background sampling, by choosing background data with the same bias as occurrence data.This method produces a bias grid that up‐weights presence‐only data points with fewer neighbors in the geographic landscape. This process is facilitated by SDM Tools -> MaxEnt Tools ->Background Selection via Bias Files->Gaussian kernel density of sampling localities.
Model Development and Validation using MaxEnt 3.3.3e
We can now assess the global potential distribution of spotted lanternfly using MaxEnt algorithm through multiple runs:
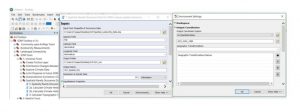
Setting up the MaxEnt Run 1 : Refer Fig1
- Provide the file containing the presence locations. To do this, use the “Browse” button in the “Samples” section of the MaxEnt screen and locate the Spotted lanternfly location_rarely_occur [SLF_Spatial_Occ.csv] generated from the Data Preparation –>Step 3
- Provide the Environmental layers of interest necessary for building this model. To do this, use the “Browse” button in the “Environmental layers” section of the MaxEnt screen and provide all the 12 bioclimatic variables of the native range – China, Korea, Japan [ bio_#.asc] generated from the Data Preparation –>Step 2.
All our environmental variables are continuous. - Check the three boxes below called “Create response curves” ,“Make pictures of predictions” and “Do jackknife to measure variable importance”
- Choose “Logistic” as output format and “asc” as output file type and the “Auto Features” box is checked
- Specify the output folder and navigate to this folder by clicking the “Browse” next to the Output Directory or type the file path
- Provide the projection layers directory/file by clicking the “Browse” button supply all the 12 bioclimatic variables of predicted distribution range – USA [USA_bioraster_bio.asc] generated from the Data Preparation –>Step 2.
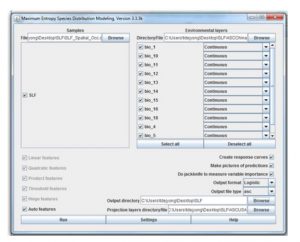
Fig 1 – MaxEnt Setting for Run1
MaxEnt Settings: Refer Fig 2
We intend to measure the amount of variability or robustness of our model through multiple runs, hence we plan to choose Replicates as 15 and leave the Random test percentage as “0” and the Replicated run type (sampling technique) as “Crossvalidate”. These options are in MaxEnt Settings->Basic tab.
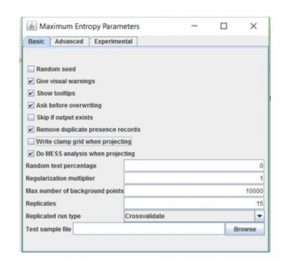 Fig 2 – MaxEnt Settings – Basic Parameters
In the MaxEnt Settings->Advanced tab, we set the Number of iterations to “500” and provided the Bias file [bias.asc ] generated from Data Preparation –>Step 4. Rest of the settings can be referred from Fig 3
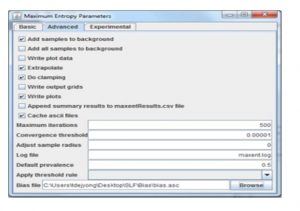
Fig 3 – MaxEnt Settings – Advanced Parameters
For the MaxEnt Settings->Experimental tab, the settings are depicted in the Fig 4
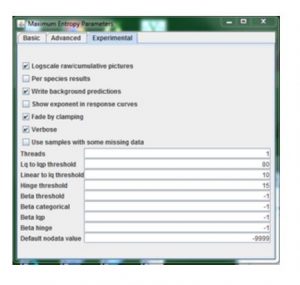
Fig 4 – MaxEnt Settings – Experiment Parameters
Running the MaxEnt:
After entering all the settings , we ran the MaxEnt program by pressing the “Run” button – Fig 1.
Interpreting MaxEnt output Run1:
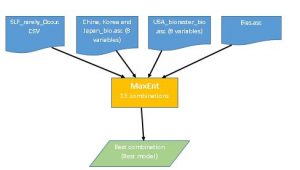
Based on the graphs and the analysis of variables contribution, we choose only the important variables and dropped the rest. As a result we choose 8 important final variables and dropped bio1, bio5, bio16 and bio15.
Setting up the MaxEnt Run 2:
We reran MaxEnt with final 8 variables, tried different features (except Auto Features) and choose Replicates as 1. Refer Fig 5
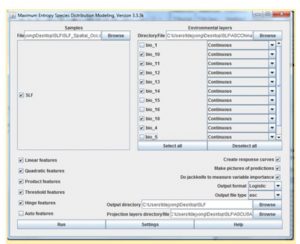
Fig 5 – MaxEnt Setting for Run2
Selecting the best model by done by interpreting graphs, AUC, Minimum training presence training omission (should be close to 0) and 10 percentile training presence training omission (should be close to 0.1)
The best model slected was Model 7 (Detail in results section).
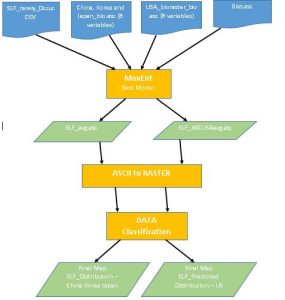
Setting up the MaxEnt Final Run: Refer Fig 6.1 & 6.2
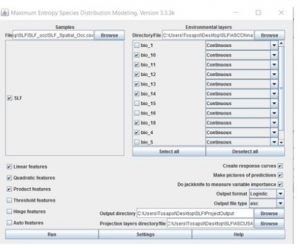
Fig 6.1 – MaxEnt Setting for Final Run
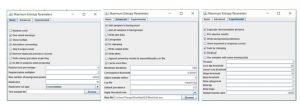
Fig 6.2 – MaxEnt Setting for Final Run
Converting ASCII output to Raster:
This is our final step where we convert the ASCII layers to raster output, i.e average ASCII files which was the generated from MaxEnt output. Here we convert both native range [SLF_avg.asc ] and the predicted distribution rage [SLF_ASCUSA_avg.asc].
Model Interpretation:
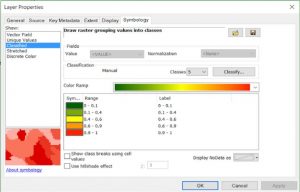
We tried different color schemes in the symbology option and changed the classification threshold to visually identify patterns of interest.
All geospatial information use GCS_WGS_1984 as a projection
Data preparation for MaxEnt
Converting Environment Raster to ASCII Format
Preparing Occurance Data and Background Selection using SDMtoolbox
Model Development using MaxEnt
First Run
Second Run
Final Run
Legend
![]()
ASCII :
An .asc file usually refers to the output created by the GRIDASCII command (ArcInfo Workstation) or Raster to ASCII tool . It’s an interchange format, used as input for analysis or storage.
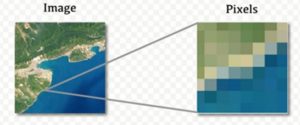
Raster Data :
Raster data also referred as grid cells are made up of regularly sized pixels.They are good for depicting continually varying information such as such as elevation, temperature or an aerial photograph. Raster data analysis is quick to perform.
Extract by Mask:
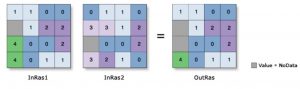
One of the Spatial analyst extraction tool that allows to extract a subset of cells from a raster that corresponds to the area defined by the mask. When input raster or feature mask data is raster, the values for non-NoData input cell locations are copied to the output raster.
Extent :
A map extent defines the geographic boundaries for displaying GIS information within a data frame. These boundaries contain top, bottom, left, and right coordinates. These are the edges of the map extent. Map extents are affected by map scale. As you zoom in or out of a map, the map extent changes, provided that the data frame size on the page remains the same.
Raster to ASCII
One of the geoprocessing tool to convert a raster dataset to an ASCII file representing raster data.We have used this tool to pre-processes raster data in preparation for Maxent modeling to ensure that all rasters have the same extent, same cell size, and aren’t missing data.
ASCII to Raster
One of the geoprocessing tool to convert an ASCII file representing raster data to a raster dataset.
Data Classification:
Grouping similar features into classes by assigning the same symbol to each member of the class. This helps to identify patterns in the data. We have classified our data manually to meet our specific criteria, by this we would like to highlight areas that have potentially risk. Below diagram is one such example, where selected ranges of data can be highlighted using a manual assignment of classes.
Species Distribution Model (SDM)
Species distribution modeling (SDM) is also known as Environmental niche modelling, predictive habitat distribution modelling, climate envelope modelling. It is a process to estimate the similarity of the conditions at any site to the conditions at the locations of known occurrence and possibly of non-occurrence of a phenomenon. One of the common application of this process is to predict species ranges with climate data as predictors, which is used in several research areas in conservation, ecology and evolution.
Presence Only Data
There are two main forms of data about species occurrences, lists of locations where a species has been found, called presence-only (P) data, and lists of locations where species are both present and absent (PA).
Background or pseudo-absence data
Modeling species distributions from occurrence records require additional data representing the range of environmental conditions in the modeled region. These data are called background or pseudo-absence data. They are usually drawn at random from the entire region.
SDM Tool 1 – Spatially Rarefy Occurrence Data
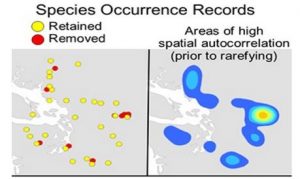
SDM techniques require input occurrence data to be spatially independent. However it is common for environmental biases from spatially autocorrelated occurrence points. The spatially rarefy occurrence data tool addresses this issue by spatially filtering locality data by a user input distance, reducing occurrence localities to a single point within the specified Euclidian distance. This is critical for model calibration and evaluation.
SDM Tool 2: Gaussian kernel density – Methods of sampling bias correction
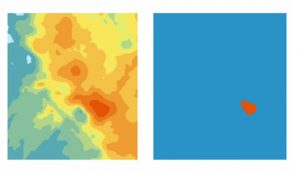
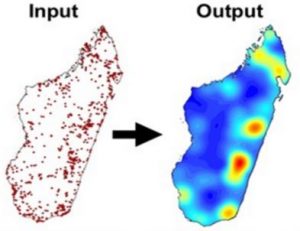
One of the limitation of presence only data is the spatial sampling bias, which could lead to incorrect predictions. This has to be reduced by some kind of sampling bias correction method. One such tool used tool used in the project is Gaussian kernel density of sampling localities. This method produces a bias grid that up‐weights presence‐only data points with fewer neighbors in the geographic landscape. To do this the tool creates a Gaussian kernel density of sampling localities. Output bias values of 1 reflect no sampling bias, whereas higher values represent increased sampling bias.
MaxENT
MAXENT is now a common species distribution modeling (SDM) tool used by conservation practitioners for predicting the distribution of a species from a set of records and environmental predictors. It is a machine learning algorithm that applies the principle of maximum entropy to predict the potential distribution of species from presence-only data and environmental variables.
The first MaxEnt result presents the potential bioclimatic variables. From 12 variables, there are 8 variables that seems to be important to predict the insect distribution. Graphs, percent contribution table and permutation importance table from MaxEnt output has been used to select the potential variables. The curves that are not similar to normal distribution, percent contribution and permutation importance is close to zero were excluded.
The best model is considered critical importance since MaxEnt has many analysis combinations. According to the table below, there are 13 different combinations by adjusting different features (L = Linear features, Q = Quadratic features, P = Product features, T = Threshold features and H = Hinge features). Graphs, AUC, Minimum training presence training omission (should be close to 0) and 10 percentile training presence training omission (should be close to 0.1) were interpreted to choose the best model which is the model 7.
Table 1: 13 Combinations Analysis of MaxEnt model by using 8 potential variables
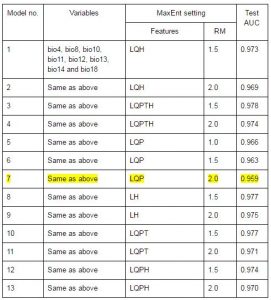
According to the model 7, the curves show the effect of each bioclimatic variable to the MaxEnt prediction. The curve which seems to be normal distribution is the good variable. In this case, bio 11 (Mean Temperature of Coldest Quarter) is the best predicted variable.
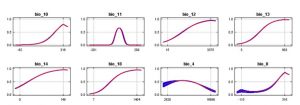
Figure 1: Response curves showing potential variables of the model 7
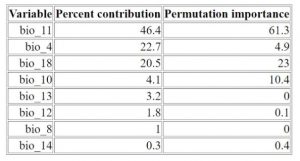
The following table gives estimates of relative contributions of the environmental variables to the Maxent model and how each variable is important to predict distributions. In the percent contribution column, bio 11, bio 4 and bio 18 are the 3 highest contributing variables. Also, bio 11 and bio 18 are the 2 highest valuable variables.
Table 2: Analysis of variable contributions
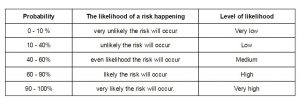
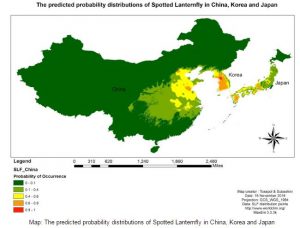
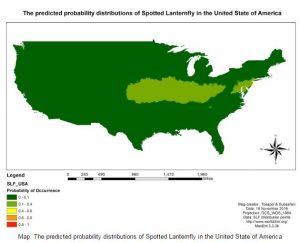
Maps below are the products from MaxEnt model. After adding the points of insect existing in China, Korea and Japan, bioclimatic variables of that region and predict to the USA by using bioclimatic variables of the USA, the red areas are the very high risk area that the insect is more likely to survive (0.9 – 1.0 probability), the orange areas are the high risk area of the insect distributing (0.6 – 0.9 probability). In contrast, the yellow areas are the moderate risk area of the insect to survive (0.4 – 0.6 probability), the bright green areas are the low risk area which unlikely the insect will distribute (0.1 – 0.4 probability) and the dark green area are the very low risk area which mean the insect is less likely to survive (0 – 0.1 probability).
Table 3: Probability of Occurrence
According to China, Korea and Japan map below, east part of the region is the risk area, which composed with red, orange and yellow.
According to the USA map below, middle-west and mid-Atlantic regions of the country are considered the risk area but it is low risk area (bright green)
Summary:
We investigated the potential distribution of Spotted Lanternfly in the US using MaxEnt model. Our study found the potential risky places in the US are the midwest and mid-atlantic regions based on the climatic factors that are favourable for the species to thrive.
Based on this study, it is evident that the economic importance of the crops are at risk. Our investigations can help the land managers prioritize resources and minimize damages and also establish a first line of defence against this invasive species before they become established. Also our study will provide awareness among the general public on this distinct and sedentary insect.
Future action:
- Our study can be enhanced and predictions can be made more accurate by including other variables like elevation, tree distribution (host plants including fruit trees, ornamental trees, woody trees, and vines ), landscape variables.
- Usage of more powerful tools like Ecological niche modeling (ENM) , whereby one could select the best model by AIC and BIC instead of AUC
- Government should consider enhancing the surveillance system in these high risk regions.
Limitation
Due to time constraint, our project development did not consider all the options of the modelling technique and also we had limitations on the computer capacity to add more variables in our modelling process to produce accurate results.
Acknowledgements
We would like to thank Dr. Melinda Laituri,Dr. Tewodros Wakie, Dr Sunil Kumar, Dan Kotter for their help and support in this project.
1.Barringer et al_2015: The first new world record of Spotted Lanternfly PA
2.Barringer, L.E., Donovall, L.R., Spichiger S.E., Lynch, D. and Henry, D. (2015). The first new world record of lycorma delicatula (Insecta: Hemiptera: Fulgoridae). Entomological News, 125(1):20-23.
3.Brown, J.L. (2014) SDMtoolbox: a python‐based GIS toolkit for landscape genetic, biogeographic and species distribution model analyses. Methods in Ecology and Evolution.
4.Dara S.K., Barringer L., and Arthurs S.P., (2015). Lycorma delicatula (Hemiptera: Fulgoridae): A New Invasive Pest in the United States. J. Integ. Pest Mngmt. 6(1): 20; DOI: 10.1093/jipm/pmv021
5.Engert, P.A., and Lansdowne, Z.F. (1999), Risk Matrix User’s Guide version 2.2, The MITRE Corporation, MP99B00000293.
6.Kim et al_2013 : Molecular comparison of Lycorma delicatula isolates in Korea, China, Japan-has GPS coordinates
7.Kim J.G., Lee, E.H., Seo, Y.M. and Kim, N.Y., (2011). Cyclic Behavior of Lycorma delicatula (Insecta: Hemiptera: Fulgoridae) on Host Plants, J. Insect Behav., 24:423–435 DOI 10.1007/s10905-011-9266-8
8.Phillips, S.J., Anderson, R.P., and Schapire, R.E., (2006), Maximum entropy modeling of species geographic distributions. Ecological Modelling, Vol 190/3-4 pp 231-259
9.Phillips, S.J. and Dudik, M., (2008), Modeling of species distributions with Maxent: new extensions and a comprehensive evaluation. Ecography, Vol 31, pp 161-175
10.Surendra K. Dara, Lawrence Barringer and Steven P. Arthurs. Lycorma delicatula (Hemiptera: Fulgoridae): A New Invasive Pest in the United States.
11.Tarcísio Visintin da Silva Galdino, Sunil Kumar, Leonardo S. S. Oliveira , Acelino C. Alfenas, Lisa G. Neven, Abdullah M. Al-Sadi , Marcelo C. Picanço. Mapping Global Potential Risk of Mango Sudden Decline Disease Caused by Ceratocystis fimbriata
12. Young, N., Evangelista, P., and Carter, L., (2011), A Maxent Model v3.3.1 Tutorial (ArcGIS v10), the Natural Resource Ecology Laboratory at Colorado State University and the National Institute of Invasive Species Science.
13. http://www.sciencedirect.com/science/article/pii/S0304380009005742
14. http://onlinelibrary.wiley.com/doi/10.1111/j.1466-8238.2012.00768.x/full
|
Dr. Tosapol Dejyong is a master student in the Department of Clinical Sciences, Colorado State University and a veterinary officer in the Bureau of Disease Control and Veterinary Services and Department of Livestock Development (DLD), Thailand. He was graduated Doctor of Veterinary Medicine (DVM) with First Class Honors from Kasetsart University, Bangkok, Thailand.
Subashini Subbaiah graduated from Colorado State University with Masters in Computer Information System. She is passionate about data analytics and driving data informed decisions |