Exploring Ecological Relationships in Survival and Estimating Rates of Population Change Using Program MARK
- Exploring Ecological Relationships in Survival and Estimating
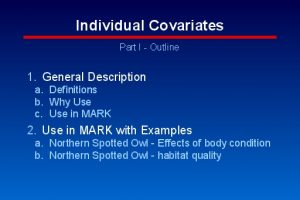
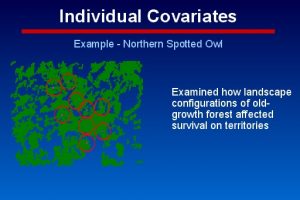
- Individual Covariates
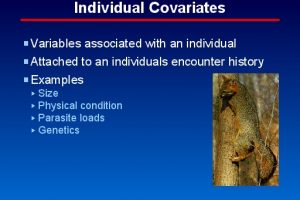
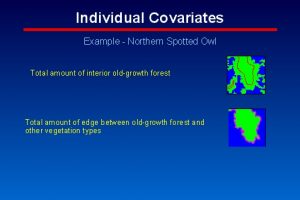
- Individual Covariates
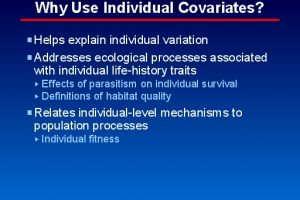
- Why Use Individual Covariates?
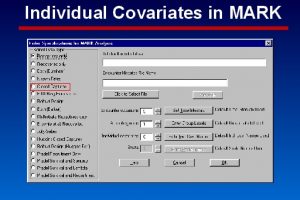
- Individual Covariates in MARK
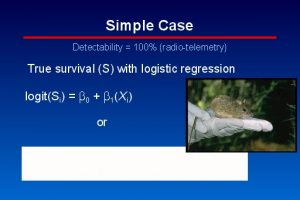
- Simple Case
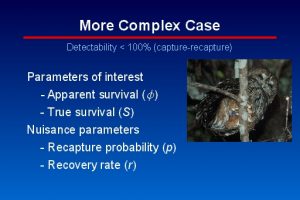
- More Complex Case
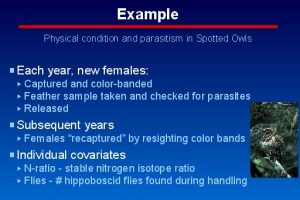
- Example
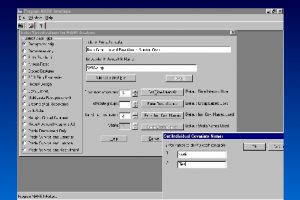
- Input in MARK
- (Untitled)
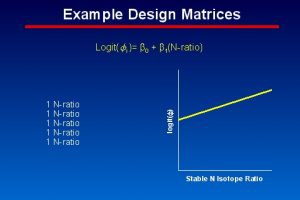
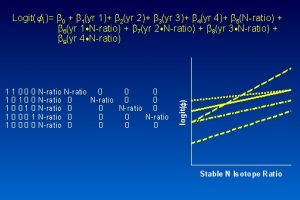
- Example Design Matrices
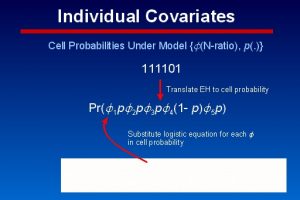
- Individual Covariates
- (Untitled)
- (Untitled)
- (Untitled)
- Individual Covariates
- Individual Covariates
- (Untitled)
- Fitness Landscapes
- Rates of Population Change
- Simple Birth & Death Model
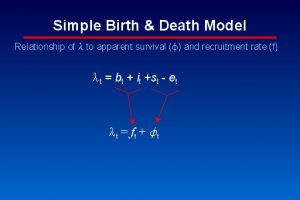
- Simple Birth & Death Model
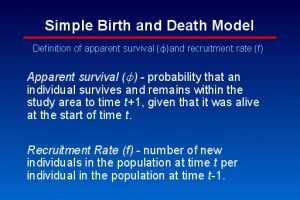
- Simple Birth and Death Model
- Simple Birth & Death Model
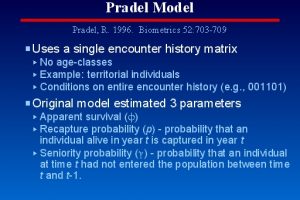
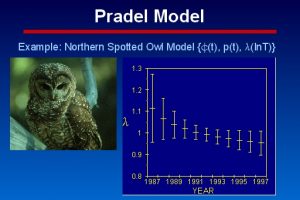
- Pradel Model
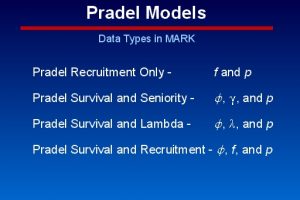
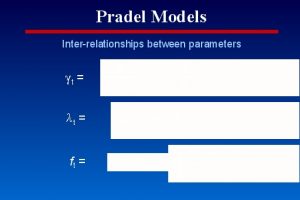
- Pradel Models
- Pradel Models
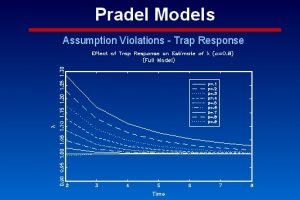
- Pradel Models
- Pradel Models
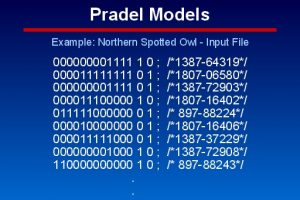
- Pradel Models
- Pradel Models
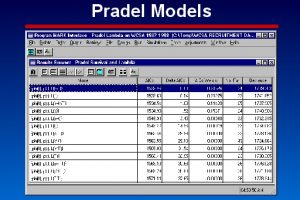
- Pradel Models
- Pradel Models
- Pradel Models
- Pradel Model
- Pradel Models
Exploring Ecological Relationships in Survival and Estimating Rates of Population Change Using Program MARK
Slide 1 of 36

Individual Covariates
Slide 2 of 36
Individual Covariates
Slide 3 of 36
Why Use Individual Covariates?
Slide 4 of 36
Individual Covariates in MARK
Slide 5 of 36
Simple Case
Slide 6 of 36
More Complex Case
Slide 7 of 36
Example
Slide 8 of 36
Input in MARK
Slide 9 of 36

(Untitled)
Slide 10 of 36
Example Design Matrices
Slide 11 of 36
Individual Covariates
Slide 12 of 36
(Untitled)
Slide 13 of 36
(Untitled)
Slide 14 of 36
(Untitled)
Slide 15 of 36
Individual Covariates
Slide 16 of 36
Individual Covariates
Slide 17 of 36
(Untitled)
Slide 18 of 36
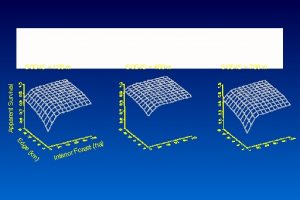
Fitness Landscapes
Slide 19 of 36
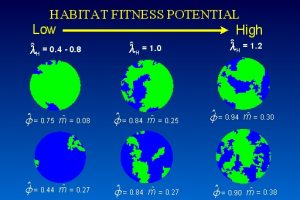
Homogeneity is not good; hetergeneity is Suggests some degree of fragmentation of the mature/oldgrowth matrix promotes high fitness Would not want to manage for the exact specific configurations here but concentrate on the trend
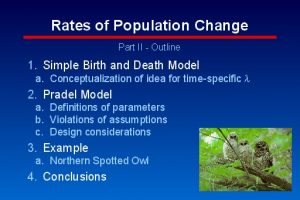
Rates of Population Change
Slide 20 of 36
Simple Birth & Death Model
Slide 21 of 36
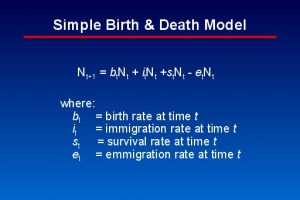
Simple Birth & Death Model
Slide 22 of 36
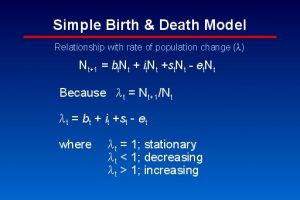
Simple Birth and Death Model
Slide 23 of 36
Simple Birth & Death Model
Slide 24 of 36
Pradel Model
Slide 25 of 36
I am text block. Click edit button to change this text. Lorem ipsum dolor sit amet, consectetur adipiscing elit. Ut elit tellus, luctus nec ullamcorper mattis, pulvinar dapibus leo.
Pradel Models
Slide 26 of 36
Pradel Models
Slide 27 of 36
Pradel Models
Slide 28 of 36
Pradel Models
Slide 29 of 36

Pradel Models
Slide 30 of 36

Pradel Models
Slide 31 of 36

Pradel Models
Slide 32 of 36

Pradel Models
Slide 33 of 36
Pradel Models
Slide 34 of 36
Pradel Model
Slide 35 of 36
Pradel Models
Slide 36 of 36
Back to Home Page
Comments or Questions?
Last update: 7/14/1999